Part 1, The 4 Evolutionary Stages of Measuring in Revu – A guest post by Vince French of Vinic Surveying
For those who don’t know, there are FREE Forums here on the UC2 website I like to call the Bluebeam Brainery. Anyone taking advantage of this community has no doubt taken some wisdom from @Vince. As the owner of Vinic Surveying Services Limited, Vince French has created some amazing workflows for collecting data using Bluebeam Revu, Microsoft Excel, and Power Query. As with all my content, I like to show what’s possible with Bluebeam Revu beyond the obvious. Vince no doubt fits this ideology, so I asked if he’d be interested in sharing in a guest blog post. As you’re about to see, Vince over-delivered which I’m pretty sure his customers in England, United Kingdom are familiar with on each project.
I always leave these guest posts in the writer’s words without edit. Vince poured major effort into this and dropped so many value bombs, I had to break this one into two posts. Be sure to check back next week.

Thank you Vince for the wisdom you’ve shared in these articles, the activity in forums, and your presence on LinkedIn and other channels. You’re a fixture in the Bluebeam community and we all appreciate everything you share.
Join Vince and me in a free live webinar coming up on November 29th to see more Civil Site Layout workflows. Please pay close attention to the start time, we’re crossing the globe on this one.
Vince writes:
Introduction
General measuring in Revu is a simple task once you learn a few basics and get going with the inbuilt tools. Lengths, areas and counts can be completed in no time at all.
To step things up to the next level, you can then start using the customisation features that Revu offers to tailor-make tools to suit your exact needs. Whether this is in terms of line styles and hatch patterns, to make things clearer, or collecting further information in the Markup List’s Custom Columns that can easily be added, the possibilities are endless.
However, the big question for me is about what you then do with the information that you generate in the Markup List if you are not exporting it to be used in some other 3rd party software. (If you are doing this though, then I highly recommend that you have a look at Doug McLean’s XCON 2022 presentation on this subject to make sure you are doing this operation in the most efficient way. XCON2020 Presentation – UC2 Community Board – UChapter2 ).
There appear to be four evolutionary stages to this process:
- Using Revu’s inbuilt features such as formulas in custom columns, legends, etc.
- Utilising Revu’s Quantity Link feature to export the summary data from the Markup List out to Excel.
- Copying and pasting the entire Markup List to Excel where standard formulas are then used to manipulate the data.
- Harnessing the power of Macros and Power Query in Excel to automate the data collection process and produce endless amounts of usable data.
Stage 1
By sorting the Markup List by Subject you can create a total for each distinct item. Legends are then used to add this information to the drawing itself.
Custom columns can then be added to provide additional details such as rates for the items measured, formulas for creating further measure details, and total values for the items measured, etc. This will enable you to provide some very useful information if you are completing some fairly simple take-offs.
The extent and functionality of the inbuilt formulas are limited which can greatly reduce the results achievable though. For example, the fact that you can’t reference something like a base rate, can make updating costs or looking at the impact of different price increase scenarios quite tedious.
Presentation of the results is also limited to adding them to Legends, which is acceptable in some cases but not really ideal.
Stage 2
Revu allows you to export summary data from the Markup List to Excel which is a massive benefit as there, you can harness the power of the endless calculation functions to provide more meaningful and easily adjustable data. The presentation of the results can also be enhanced to how you want to see them. However, it is just the summary of the items which can cause issues.
Stage 3
This is the stage at which things start to get interesting to me, as instead of only using summary data from the Markup List you can actually use ALL of the data. This enables you to not only perform more complex calculations but to also break down the results further.
Using just formulas, you can automatically generate lots of additional information such as breaking down quantities and values into plot allocations on a large housing site, splitting any values down into labour, plant, and material elements, etc… This is done by exporting the Markup list to a CSV file and then copying and pasting that into an Excel spreadsheet. Thereafter there shouldn’t be anything further for you to do apart from look at the results that have been generated as, once the template spreadsheet has been created details such as tables sizes, formatting, formula references, etc… can all automatically adjust to suit the extent of data from the CSV file.
Stage 4
Excel includes the ability to automate processes using the inbuilt VBA Macro and Power Query tools. These do take time to learn but the rewards for doing so can be immense.
First, Power Query enables you to pull data into a spreadsheet from outside sources without actually having to open those sources. This means that once you have exported your data from the Revu Markup list to a CSV file you don’t need to touch it again as Power Query will find that CSV file and extract the data therein.
Secondly, Power query can then be used to carry out various manipulations of that data including transformation of data types, merging and appending data, rounding up and down numbers, resorting, grouping, etc.
Thirdly, VBA macros can then automate other aspects of the spreadsheet e.g., jumping between different reports, updating information such as dates, applying formatting, identifying and taking you to possible errors in your information, etc.
What Does This All Mean in Real-World Scenarios?
To demonstrate each of the above stages, over the next few weeks we will look at a fairly simple workflow for measuring fencing. There is nothing complicated in this, just some lengths and counts but the data that can be output and the ease at which it is done varies considerably, even though you use exactly the same Markups for each stage.
Stage 1
This first video demonstrates the setup for completion of the workflow in Revu alone.
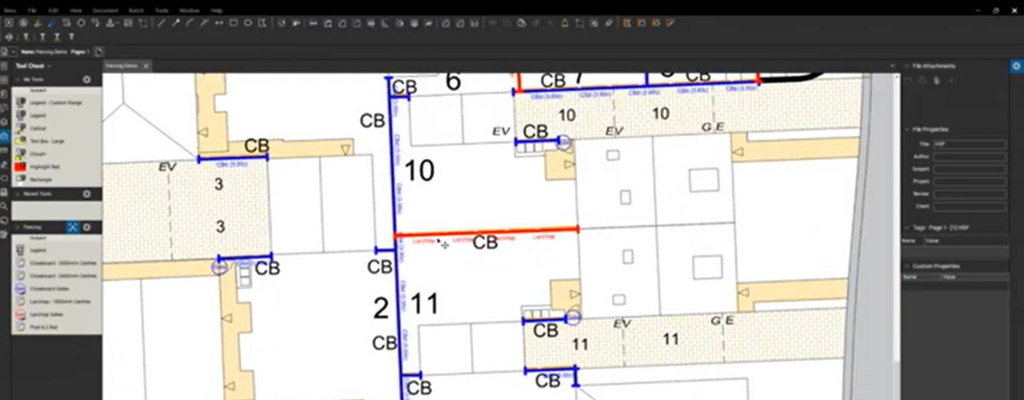
We start by adding a few custom line styles and count items, so that the items measured on the drawing are clearly identifiable to all. The two types of closeboard fencing have the same blue line but further information has been added to show exactly which type is being measured. Gates are shown with a circular markup so there is no need to worry about the rotation of the markup. I won’t go into how to create these as Troy at UChapter2 has plenty of resources to show how to complete these tasks.
These custom markups are all that will be used for all of the different stage demonstrations to show how the data collected in Revu can be used to produce varying amounts of details, which are then used for pricing purposes, etc.
The other thing that has been done is to use the Labels column to allocate the individual markups to Plots.
For Stage 1, to produce the results, we have also added some custom columns to be used for adding item rates, calculating further quantities, etc. (Once again, if you are interested in learning more details about this then I suggest you look at Troy’s back catalogue).
The first couple of Custom Columns simply add a rate per metre for the basic fence and then a calculated total.
The next set of columns look at the details for the posts. I like to measure these separately as they can add a significant amount to the overall cost when shorter runs are being looked at or when the last panel of a fence is not a full length. For example, if you measured 90m of fencing of a fence with posts at 3m centres then you would need 31 i.e., one every 3m plus a starting post, which is an average of one every 2.90m. If you have a fence that is only 7m long you will need 4 posts which are at an average of 1.75m.
- The custom column for calculating the number of posts takes the length of the fence and divides it by the centres. This is then automatically rounded up to the next whole number using Revu’s inbuilt ceiling function and then a further post added.
- The gates are then added in the same way as the main fence measures i.e., a rate is applied to the count measurement to give a total value.
- Finally, a Total Value column is used to add up the values of the fence, posts, and gates.
A legend is then added to the drawing with the data from the Markup List being used to populate it.
The legend displays the summary data for each Subject. What it cannot do is display the details for the allocation to individual or groups of Plots which, would be extremely helpful when you are looking at larger projects. Also, you cannot provide a total value for the project so you will need to add this up elsewhere.
Further issues with this workflow include: –
- You need to add multiple additional Custom Columns if you start wanting to look at breaking the costs down further e.g., into labour, plant, and materials.
- If you do add multiple columns, then the whole workflow starts to become unfriendly to use and errors are easy to make. e.g.
- It can be difficult to see everything if there are too many columns.
- Any rates being carried forward that have a blank value can cause errors in the subsequent formulas.
- If you want to update rates to reflect price changes, etc. you need to highlight each group of Markups and make the changes in the properties panel – this is not a quick process and can be susceptible to user input error.
Summary for Stage 1
- Pro’s
- Everything is in one place.
- The summary is updated as you update the markups.
- Extremely easy to use once the custom tools and columns are set up.
- Con’s
- The extent of the inbuilt formulas restricts the calculations that can be undertaken.
- Limited on how you present the data i.e., just a legend.
- Limited amount of data that can be presented
- Restricted to the basic Legend layouts.
- Summary of measures only (although the Markup List contains more details such as the total values for each markup).
- Can’t add a total for all the works.
- It’s difficult to update the rates
- Will need to highlight the markups in their subject groups to make changes.
- Looking at different scenarios difficult e.g., what will a 10% increase on just the materials do the overall price?
- Extremely difficult to break down the costs into different sub-sections as there would need to be endless amounts of custom columns and formulas.
- Summary
- Great for smaller jobs where the rates aren’t going to need to be changed and the data only needs to be presented as a total for each Subject.
Stage 2
From this stage, we can introduce the use of the facilities and functions that Excel offers.
So we start by setting up a page where the rates for the various items to be measured can be calculated. We can use base rates for items such as the different types of labour, allowances for overheads and profit, and allowances for increases. This makes the final rates dynamic e.g., if you increase the day rate for a fencer then, all rates that are subsequently calculated including this initial rate will be instantly updated. Ultimately this means that you can adjust just one cell to update all of the linked rates, whereas, in Stage 1, this would have to be done by highlighting individual or groups of markups and then making adjustments.
This rates page is now the foundation of the pricing of the works for Stages 2, 3, and 4.
(Once again, for a detailed look at how Quantity Link is initially set up, please refer to the lessons given by Troy on the UChapter2 website).
For pricing the works in Excel, you can enter any description that you like as this does not have to be the same as the Subject in Revu. The link to the Revu document is then created with the quantity unit being optional. This means that you can choose to change the description of “Count” to “No” if you want to.
At this stage, you can also look at how you want to finally present your data. Layouts, colours, fonts, formatting, etc. can all be easily adjusted to your exact requirements.
The rate and total values for each item are then added by linking to one of the rates you have already set up. The impact of adjusting the base rates can be seen instantly.
Also, as with Stage 1, as soon as you make any adjustments to the Markups in Revu then you instantly see the new totals on your Excel summary.
However, once again you are only using the summary data from the Markup List so you can’t look at allocating the costs to the different plots.
Also, using Quantity Link is not as straightforward as it first appears: –
- Adding new Markup items in Revu requires manual adjustments to your summary in Excel. As there are no reminders to let you know of a new item then it could be possible not to add this to your calculations.
- The initial setup process can be quite long if you are measuring a considerable number of different items.
- If you have a number of different Markups, then these can be missed from the initial setup.
The biggest issue in using this setup though is the fact that Quantity Link does not let you reference a column in the Markup List that contains a formula. So, in our fencing example, we can’t bring forward the number of posts as there just isn’t an option for linking to this column. This doesn’t appear to be too much of an issue until you realise that you are only importing summary data i.e., the total length of a fence type. As a result, you have no way of calculating the number of actual posts required.
So, unfortunately, for this example of measuring some very basic fencing, Quantity Link is simply not a viable option.
Summary for Stage 2
- Pro’s
- The quantities update automatically in Excel as you update the markups in Revu.
- Being able to easily update the rates to look at different scenarios.
- Being able to adjust the presentation.
- Con’s
- Linking details can be time-consuming if you have a lot of them.
- Adding new items once again will involve more time.
- Items from the Revu Markup List can easily be missed in the Excel spreadsheet.
- Big con’s
- You can’t reference all the columns in Revu so in my example, this means that you can’t find the actual number of posts required.
- Summary
- Once again this is very useful for smaller projects.
- It is easy to adjust costs, but this plus is offset by the fact that you cannot produce all of the measures that you actually require.
- A presentation can be made to suit your requirements.
I hope you enjoyed Vince French’s description of the evolution of measurements. Make sure to catch part two of this article next week. With Bluebeam Revu so versatile and customizable, you’re really only limited by your own creativity to develop powerful workflows. If Revu is changing the way you do business, I’d love to help tell your story here on UChapter2. Even the shortest stories can spark ideas. Email your story to me at Troy.DeGroot@UChapter2.com

Responses