Part 2, The 4 Evolutionary Stages of Measuring in Revu – A guest post by Vince French of Vinic Surveying
This is Part 2 of a guest post. For those who don’t know, there are FREE Forums here on the UC2 website I like to call the Bluebeam Brainery. Anyone taking advantage of this community has no doubt taken some wisdom from @Vince. As the owner of Vinic Surveying Services Limited, Vince French has created some amazing workflows for collecting data using Bluebeam Revu, Microsoft Excel, and Power Query. As with all my content, I like to show what’s possible with Bluebeam Revu beyond the obvious. Vince no doubt fits this ideology, so I asked if he’d be interested in sharing in a guest blog post. As you’re about to see, Vince over-delivered which I’m pretty sure his customers in England, United Kingdom are familiar with on each project.
I always leave these guest posts in the writer’s words without edit. Vince poured major effort into this and dropped so many value bombs, I had to break this one into two posts. Reference back to Part 1 Here.
I always leave these guest posts in the writer’s words without edit. Vince poured major effort into this and dropped so many value bombs, I had to break this one into two posts. Be sure to check back next week.

Thank you Vince for the wisdom you’ve shared in these articles, the activity in forums, and your presence on LinkedIn and other channels. You’re a fixture in the Bluebeam community and we all appreciate everything you share.
Join Vince and me in a free live webinar coming up on November 29th to see more Civil Site Layout workflows. Please pay close attention to the start time, we’re crossing the globe on this one.
Vince continues:
Stage 3
In this stage, we use the same page of rates as stage 2.
A new page is also required for adding the Markup List data which needs to be exported from Revu to a CSV file and then imported into Excel. And as we are not using any Macros or Power Query, this process needs to be done by opening the CSV file, copying the data and then paste it into the spreadsheet.
This will need to be done every time the markups are updated, and a new output is required. Obviously, this is a major downside compared to Stages 1 and 2 where any changes in the markups result in everything else being automatically updated.
However, the reason for using this method is to be able to use all the data in the markup list. For the fencing example, this not only gets over the problem of not being able to calculate the number of posts, but we also are able to use the Plot details that are entered in the Label column.
It should also be pointed out at this time that the Revu setup does not require any custom columns in the Markup List as we just need the information from the Length and Count columns.
In Excel, before we can generate any outputs, we first need to add a few helper columns which create unique identities for the types of fences to each plot allocation. If we don’t do this, then it is impossible to create the various breakdowns that we want.
In this fencing example, the first column is created by combining the Subject with the Label. The second column chooses the quantity to be used i.e., the length if there is one and, if not, the count. The final column calculates the number of fence posts.
Once the helper columns are set up then it is relatively easy to start producing output figures that are useful e.g.
- Totals quantities for each fence type allocated to plots.
- Prices for all fence types to each property.
- Prices further broken down into labour, plant and materials.
- Summaries produced for each fence type.
- Summaries produced for each plot.
Using the latest formulas along with conditional formatting in Excel, the output is dynamic so there is no need to update the output page should the extent of the report change in terms of the number of rows or columns. This also means that any new Subjects in Revu e.g., a new type of fence or gate, are automatically included in the breakdowns. Of course, details for these items will need to be included on the rates page.
We can also use conditional formatting to draw attention to possible errors e.g., if there isn’t a rate next to an item then we could have the cell automatically turn red to let us know it needs reviewing.
Finally, as with Stage 2, any adjustments made on the rates page will result in the various output summaries being automatically updated. This means it is easy to look at the effects of a 10% increase on materials, what would happen if the fencers’ rate was increased by £10 per day, etc.
Summary of Stage 3
- Pro’s
- The additional cost reports can be automatically generated.
- The reports are dynamic so will expand or shrink to what you require.
- New items measured in Revu are automatically included in the breakdowns once the copying and pasting has been completed.
- Negates the need for some of the custom columns in Revu.
- Big Pro’s
- You can use every single piece of data from the Markup List if you want to.
- Big Con’s
- You need to export the markup list to a CSV file and then copy and paste that into Excel (although this can be remedied by using macros, but we are not considering those in this example).
- Summary
- A less user-friendly setup but one where you can choose how the data is presented, it is easy to update costs and the additional data that can be generated from using all of the Markup List is considerable.
Note: – since recording the demonstration for this stage I’ve discovered that there is a glitch with the version of Revu that I am using which results in the layer assigned to the custom tools being automatically deleted after being used the first time. This has now been reported to Bluebeam and a fix will hopefully be applied soon.
Stage 4
Macros and Power Query both add extra dimensions to what Excel is capable of. It would be impossible for me to try and explain everything here, so I’ll just restrict my comments to how they are used in the fencing example.
Macros are used to enable a click of a button to automate a process, automatically update formatting or display buttons if certain conditions are met, etc. Power Query on the other hand is used to automatically collect the data from the Revu-generated CSV file then manipulate that data in numerous different ways in order to obtain all the output data that we require.
Along the way, Power Query can also import data from other sources to add to the Revu data. In the fencing example, the extra data comes from Tables within the spreadsheet.
Once again, the page of rates from Stage 2 is used. However, an extra column has been added to enable the data to be broken down further into Bill Sections.
In Power Query, we start by importing the information from the CSV file. The data is then categorised into data types and filtered to remove any unnecessary items. The pricing details from the Rates page are also imported and treated in the same way. This creates all the source data that we need to be able to generate the output data.
The number of fence posts is generated by merging the Revu CSV information with that from the Prices table which includes the spacing details along with the material details for the posts. A formula in the Query will work out the number of posts depending on whether the item being looked at is a run of fencing or a gate. If it’s the former, then the formula is once again the length of the fence divided by the centres which is then rounded up to the next whole number and then a further one being added. If the item is a gate, then two posts are added.
Similar manipulations are then carried out to add rates to the different items which are in turn used to generate the plot by plot, fencing type summary, etc reports.
At this stage though, the reports are basically only what were produced in Stage 3 although how they are linked and the display possibilities are somewhat different.
The next steps start to show what other possibilities there are though.
Firstly, as we have calculated the rates including using the hours for each worker, this information can be used to tell us how long the works to each Plot should take. If we wanted to, we could also generate a report telling us how long each individual item should take. This can be extremely useful information as it can be used to provide duration targets for operatives, or it can be used to see how they have done after works have been completed.
Secondly, an extra table in our spreadsheet contains details of the materials to be used in each fence type or gate. By merging this table with the data from Revu we can start producing a full material list. This is not only done as a summary of the total amounts required but the Plot-by-Plot details are also generated which means that there is a call-off list for each section of the works.
Should you wish to add further reports to suit how your company works then this is possible. For example: –
- You could add an input table to record the actual man-hours to complete each section of the works. The details from that table could then be automatically compared to the original allowances and a report generated.
- If you use price work gangs then a separate table of their rates can be added to the spreadsheet and a set of prices for them generated alongside your rates for the work. From these, the expected profit details can be generated.
As with Stage 3, conditional formatting can be used to draw attention to possible errors but so can Power Query with added details e.g., a table could be produced which shows markups which are not allocated to Plots. The fencing example is fairly basic so to many this may not appear to be that important however, the more complicated the setup then the more important such checks are.
Summary of Stage 4
- Pro’s
- Being able to merge data from different sources to create endless amounts of reports and other useful data.
- Reports are dynamic.
- New items are automatically included.
- Warning and check systems can be put in place.
- Negates the need for some of the custom columns in Revu.
- Big Pro’s
- Once the CSV is generated by Revu you don’t even need to open that file.
- Updates are run at the push of a button.
- Con’s
- You need to export a CSV report from Revu then push a button in Excel to update everything.
- Summary
- From a minimal number of Markups in Revu, you can produce endless amounts of extremely useful information and the whole process is basically automatic so there is no chance of human input error.
Note: – as with Stage 3, when recording the demonstration there was a glitch with Revu leading to the layer details not being added to all the markups.
Overall Summary
The amount of usable data created by using the same set of markups varies greatly between the four stages. Which Stage you use will depend on just how much information you need to generate but the start pointing is always a clear concise set of Markups in Revu.
Further Examples
Hopefully, the four previous video demonstrations show what can be done with the same basic Markups in what is a very simple take-off but, what if you have something more complex? I’ve looked at possible set-ups for measuring drainage, foundations, roof tiling, etc. on large housing developments. Unfortunately, Stages 1, 2, and even 3 can’t create the information that I need for most of these e.g., for looking at things such as the actual final quantities, materials required and cost reporting.
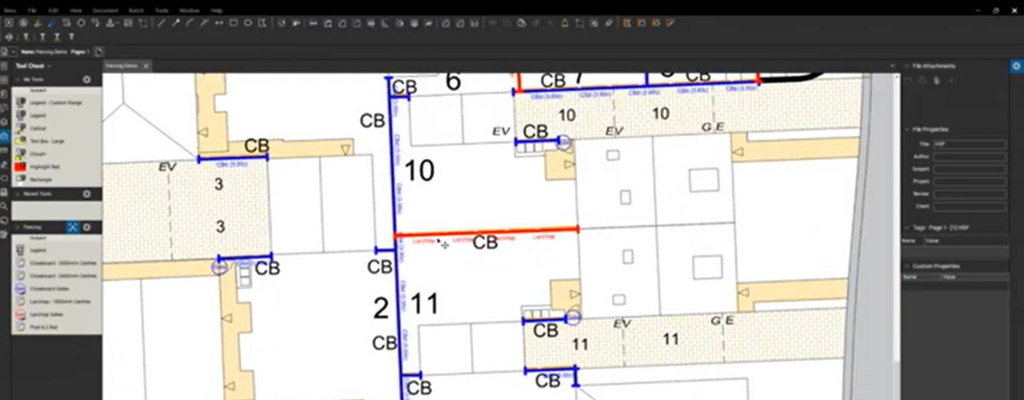
The following video demonstrates the roof tiling set-up where the number of Markups required is kept to a minimum which in turn means the speed at which they are done is maximised whilst clarity is maintained on the drawings.
From these few basic Markups, the reports generated include costings broken down in various different ways, material quantities broken down into each plot for ordering purposes and there is even a final report, which is a tender submission to be sent to the client.
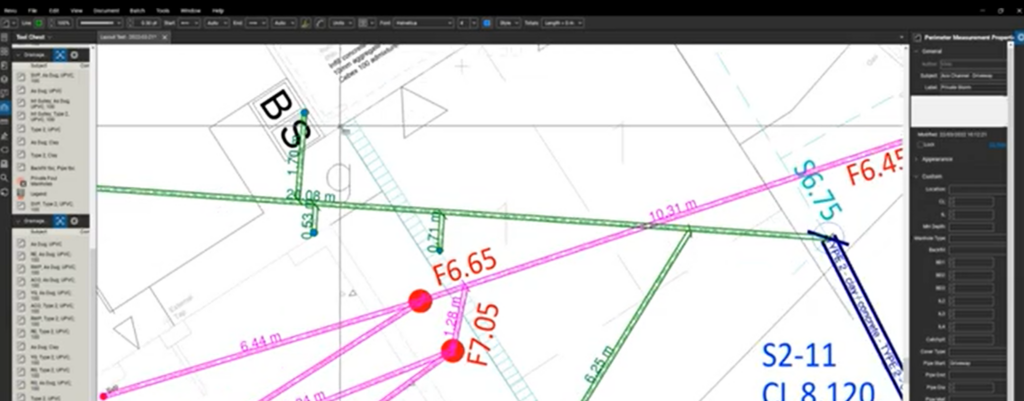
The last video is of a setup for measuring drainage and shows how far things can be taken. Custom tools and columns are used in Revu to collect the initial data, there is the option of being able to enter details for the manholes in both Revu and Excel which helps depending on how the information is presented to you, merging and appending information from a significant amount of different tables, applying checks to ensure items have not been missed, etc. all whilst providing a marked up drawing which is easy to follow.
Final Words
The requirements in terms of the output details will depend on a number of factors including size and complexity of the job, number of different types of Markup, size of the contractor, the need to be able to quickly update prices, etc. There is no ‘one size fits all’ ready to use software solution out there however, the beauty of Revu is that it allows users to create solutions that fit their specific needs.
I hope you enjoyed Vince French’s description of the evolution of measurements. With Bluebeam Revu so versatile and customizable, you’re really only limited by your own creativity to develop powerful workflows. If Revu is changing the way you do business, I’d love to help tell your story here on UChapter2. Even the shortest stories can spark ideas. Email your story to me at Troy.DeGroot@UChapter2.com

Responses