Advanced Use Cases for Quantity Link in Bluebeam Revu
Let’s take those Quantity Link connections a bit further this week. I want to follow up with some advanced use cases for Quantity Link by elaborating on the points I introduced in my article on Bluebeam’s Built Blog “Top 5 Reasons to Use Quantity Link in Revu.”
Just to recap, the 5 reasons I listed were:
- Presentations.
- Legacy spreadsheets.
- Easily Update Revisions.
- Standardization and Consistency.
- Assemblies.
Before I break each one down, hopefully, you put my last blog post to use “How To Easily Set Up Quantity Link in Bluebeam Revu” and you gave it a practice run. You created some custom tools and linked them to a blank practice spreadsheet to see the live connection in action.
If you run into any trouble or have questions, don’t forget to join the free Brainery community to get those answers to propel you forward.
In the steps last week, I think we covered “Standardization and Consistency” by showing you how to build custom markup tools your entire team can use. When you’re ready to share those tools with your team, check out my tips in the Brainery thread “Sharing Toolsets & Profiles”. Then we connected those custom markup tools to a spreadsheet. I hope this was descriptive enough to help you navigate linking to your “Legacy Spreadsheets.” To wrap things up, let’s look at the remaining three reasons starting with the easiest to implement followed by the more advanced. Don’t be intimidated by “Advanced”. Instead, be inspired by the possibilities. I’m always here to help.
Easily update Revisions.
I see a lot of users marking up drawings with simple dimensions and taking notes off to the side which creates a nightmare when a revision comes in. They have to figure out what all the scribbles and colored highlighters meant on a specific day. I’ve seen others do great markups in Revu, only to start over with the revised print.
In Revu, when a revision comes in, you don’t have to search to find the differences in the drawings while cursing out the designers for never clouding the changes. You’ll find Bluebeam Compare Documents in the menus under Document > Document Compare you’re able to point to the original and revised drawings and Revu will cloud all the changes for you!
Once you find where all the changes are, there is also a tool for Bluebeam Overlay. Go to Document > Overlay Pages, point to the same drawings, and Revu will show each in different colors so you can see what changed. Check out Bluebeam Document Compare/Overlay & Tip where I show the steps below to combine these two features into one document.
Now that you’ve pinpointed where and what was changed, how do you get all your old markups to the revised sheet without starting over? It’s easy, check this out!
- With the new revised drawing open, go to the Markups List menu at the top left of the Markups List panel (usually at the bottom of the interface).
- Select Markups > Import (Ctrl + F3) and navigate to the original drawing with your estimate markups.
- Click Open and watch all the markups import into the new sheet without effecting the original.
Now, simply look at those clouded areas and use the yellow grips at the corner of your measurements to update the existing markups (Remember to hold down your Shift key to add grips if the new shape requires more flexibility). It’s very important now to reset the source file in the spreadsheet to look at the revised drawing. Now that your markups are updated, the source file is linked, you should see the difference in the cost and totals of those particular materials.
Presentations.
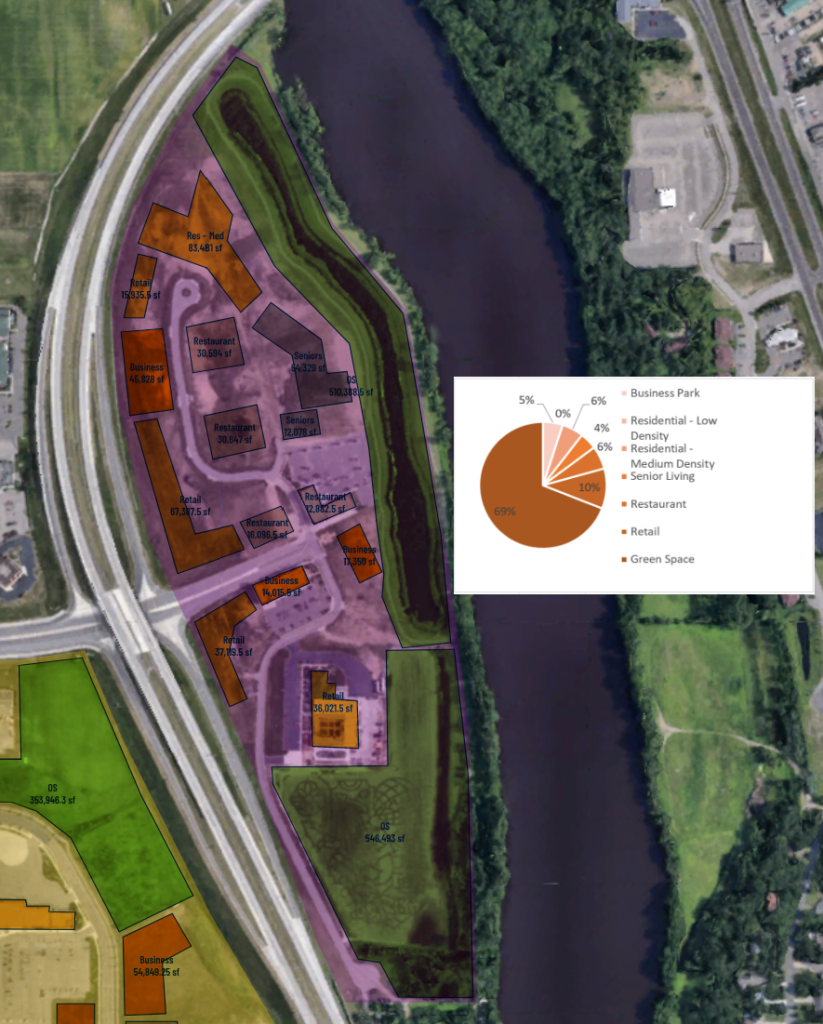
Let’s run with last week’s example regarding a new development “Land Use” presentation. In our presentation to the public, we need to give a visual breakdown of which areas will be used for what purpose. We also need to include which areas will be left “green” or undeveloped.
The steps are really no different from what were introduced to last week:
- Create custom tools in your tool chest for the different types of land use. For example, Low Density Residential, Senior Living, Retail, Restaurant, Parking, Business Park and Green Space. I like to assign different colors to each of these markups, so they set themselves apart on the map and tell a visual story. I also like to enter the “Use” into the Label of the tool, so it displays on the map, sometimes choosing a white text color so it stands out.
- Next, on a map of the development area, use your tools to draw in the specific areas and what they’ll be used for.
- Make sure you create and link a spreadsheet with the information you want to display. Always start with the end in mind. Think of the presentation, build the spreadsheet, and build the tools so everything has the final purpose in mind.
Next is the part I want to focus more attention on. I’m not an expert at Microsoft Excel, so I’ll keep this pretty simple:
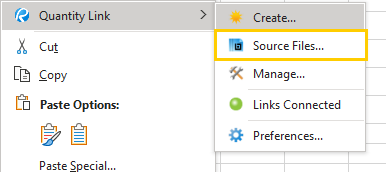
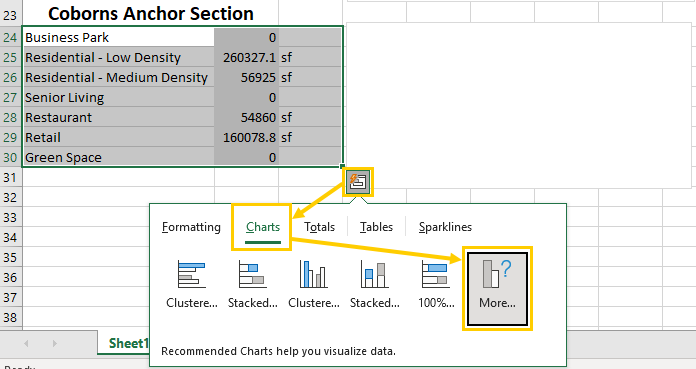
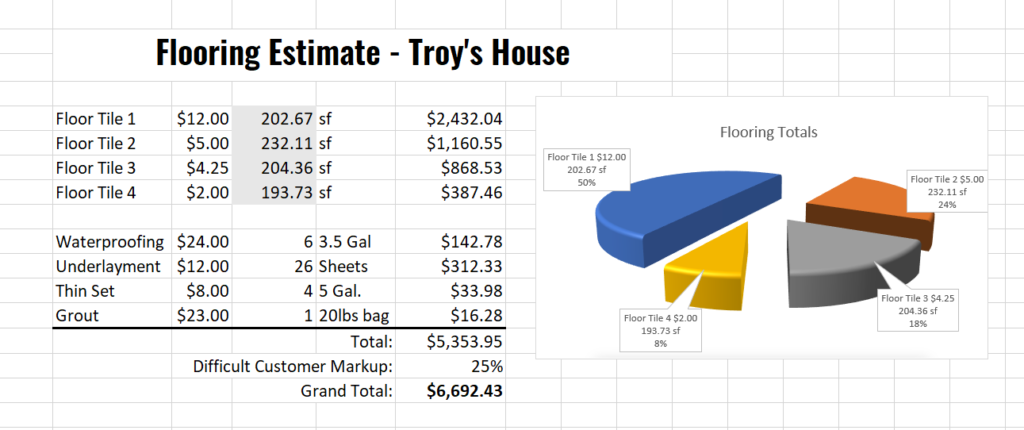
- With your data showing on your spreadsheet, draw a window selecting all the cells containing the use and the area measurement.
- Once selected, you’ll see a button at the bottom right corner of the selected cells. Click on the button and select Charts > More..
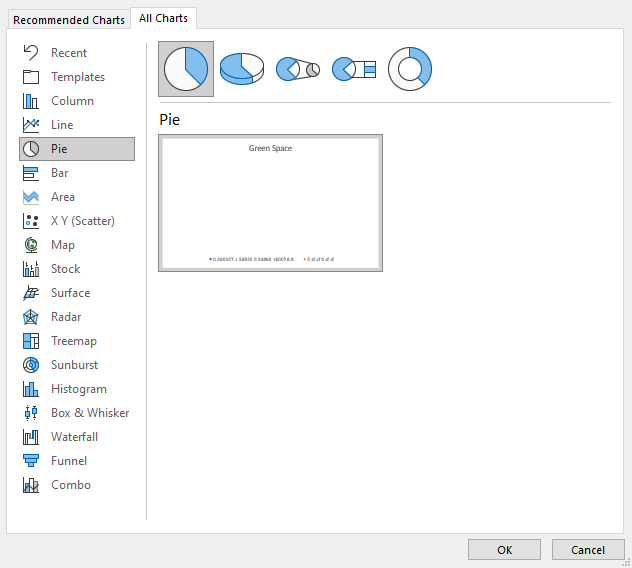
- In the resulting window, select the type of chart you want to display. You can also go into the properties of the chart and set your color scheme (presentation points if you match the area markups to match the chart). If you like Food Network competitions like I do, you know people eat with their eyes first. Whether you’re building a meal, or a poster printed on foamboard, the purpose of a presentation is to sell your idea. Don’t lose the deal because you didn’t plate your food beautify.
- Because the information in the chart is representing the data linked to Revu, the cells and chart will update when the markups are updated. This makes for a quick way to show different variations on the fly. Depending on presentation type, you could show the spreadsheet directly, or drop a screenshot of the chart on the corner of the map drawing.
Pretty cool integration of tools, don’t you think? Now don’t limit your ideas to the cost of materials or land use. This can be used for just about anything. For instance, occupancy loads, or maybe your calculating cut/fill ratios so you know how much material you need to bring in. In that case, if your chart is anywhere off of 50/50, you’re either hauling out or hauling in materials. Also, if you are creating PDF’s to show in a PowerPoint-type situation, don’t forget about Bluebeam Presentation Mode. This can be found in the menu Window > Presentation (CTRL+ENTER). This setting will remove all the tools to just show the document. Use your up/down arrows to advance pages.
Stick with me here, we’re almost done. If my food talk sent you off for a snack, come back to me for a minute.
Assemblies.
I hope you made it this far in the article because this is where we might just blow your mind. I have no idea if anyone even reads what I publish. Let me know you made it this far by giving me a like down below.
I don’t want to derail my article, but I’d like to introduce you to a new section of my articles. I’m not sure how often she will appear, I’m going to call it “But Troy”
“But Troy,” you say, “do I have to create a tool for every single piece of material? Do I need a tool for anchor bolts, studs, nails, and truss clips?”
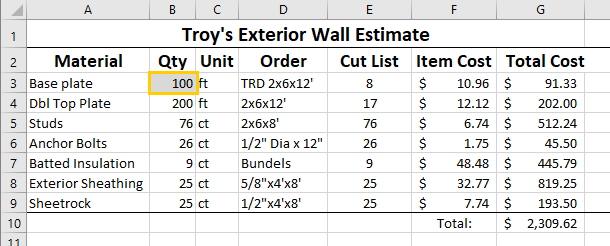
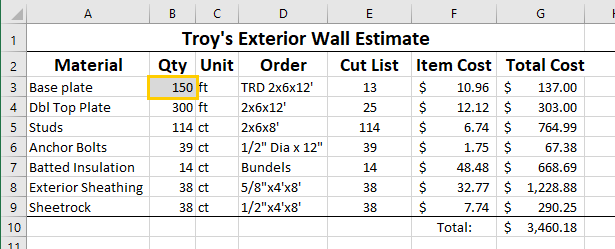
The answer is NO because we can build assemblies to account for those materials. The facts are in the formulas, my friend. Let’s start with the end in mind and create an estimate for a single exterior wall. To build that wall we need 2×6 treated base, double 2×6 top plate, 2×6 studs at 16”oc, maybe ½”x12” anchor bolts at 48”oc, 5/8” OSB sheathing on the exterior, batted insulation, and ½” sheetrock on the interior. Did I catch everything?
7 materials, 1 tool.. Challenge accepted.
More than likely, we’re measuring linear feet of wall on a plan view, so we use the Polylength tool to create an “Exterior 2×6 Wall” tool. Next, we link that custom tool into our spreadsheet. After the link is established the cell will shade itself grey, indicating the content is pulling from Revu. Next, we build the spreadsheet to include all those different materials.
As you can see, all the materials are simply a factor of the linear footage of the wall. You can take it as far as you want adding material cost, totals as you see above, or even add a column for labor cost.
You can see in column “F” in the spreadsheet you have the freedom to update the individual item prices as often as needed and the formulas will provide new totals. No more outdated price lists or complicated software to updates. Also notice in column “E” you have your cut list to order materials. All you did was trace a line over the walls on the plan!
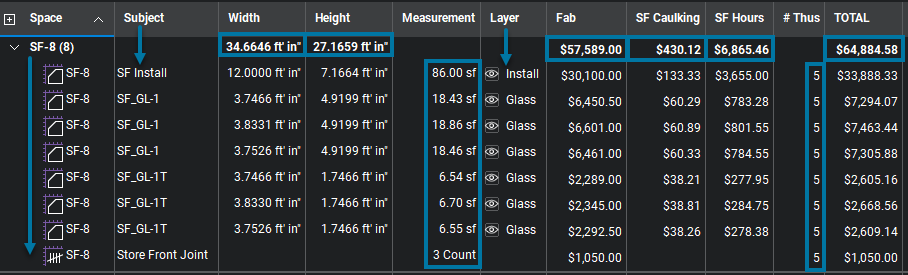
In this second image, notice I updated the length of the wall in cell B3, and all the material quantities and total costs adjusted automatically. I know this is a professional group, but to the guy in the back who just mumbled “Holy $h!t” under his breath, we heard you, and the whole class is laughing in agreement. And that seems like a good place to end. Leave me a comment to let me know your thoughts, I’d love to hear from you!
Advanced use cases for Quantity Link in action!
Need Help?
Obviously, these are just a few examples of advanced use cases for Quantity Link in Bluebeam Revu. If you’d like to hand off tool creation, linking, training, or any piece of your implementation, please don’t hold back a chance for me to geek out on your business workflows. Click here to schedule a free introduction call.
Also, I have upcoming training for these topics as well, grab a seat.
Bluebeam Material Takeoffs & Estimates – Basics
Bluebeam Material Takeoffs & Estimates – Advanced
Responses